Figure 5.
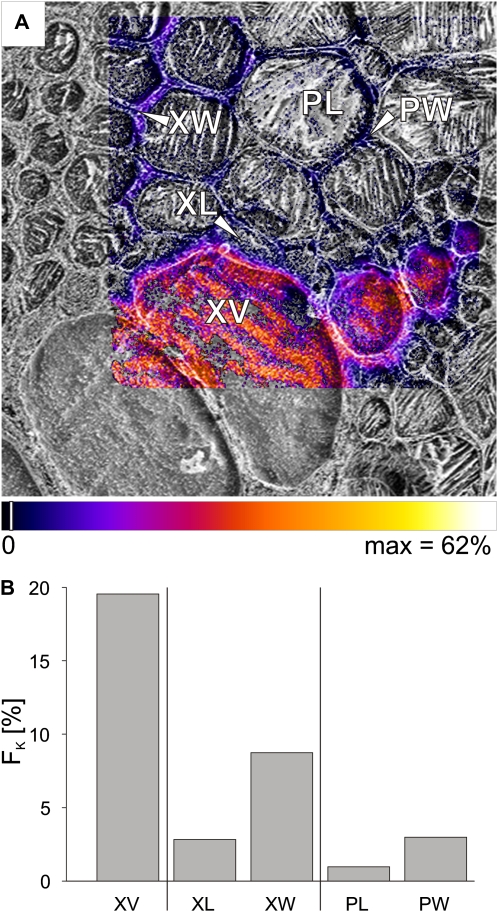
Mapping of fractions FK of potassium, originating from the tracer solution, imaged at high spatial resolution after 20 min of tracer application via the cut stem. A, Potassium tracer fraction (FK) imaged for a bundle of metaxylem vessels as overlaid on the corresponding cryo-SEM image. The area was also imaged at low spatial resolution, as shown on the right side in Figure 3C. B, Bar chart of FK representing ROI for the xylem vessel (XV), the lumina (XL), and walls (XW) of small thick-walled xylem parenchyma cells bordering the vessel, as indicated in A. FK was also calculated separately for the lumina (PL) and walls (PW) of the pith, as visible toward the top right in A. Area scanned by cryo-SIMS was 121 × 121 μm, 256 × 256 pixels. Pixels were set transparent for fractions below a threshold of 2% of the scale (indicated by white lines in the color bar). The striped appearance of the xylem vessel lumina is probably due to the growth of ice crystals (Metzner et al., 2008).

