Figure 4.
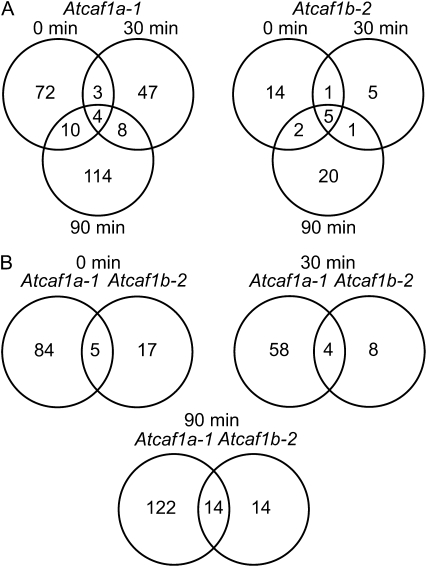
Comparison of Atcaf1a and Atcaf1b dependent transcript profiles. A, Overlap between genes misexpressed at 0, 30, and 90 min post wounding in either Atcaf1a-1 or Atcaf1b-2. B, Comparison of Atcaf1a-1 versus Atcaf1b-2 misregulated genes at each time point. The minimal overlap observed for all comparisons is statistically significant at a P value of at least 3.04 × 10⁻⁸. Misexpressed genes in each mutant were determined based on an increase or decrease in expression level of at least 2-fold (P ≤ 0.05) relative to wild type at each respective time point.

