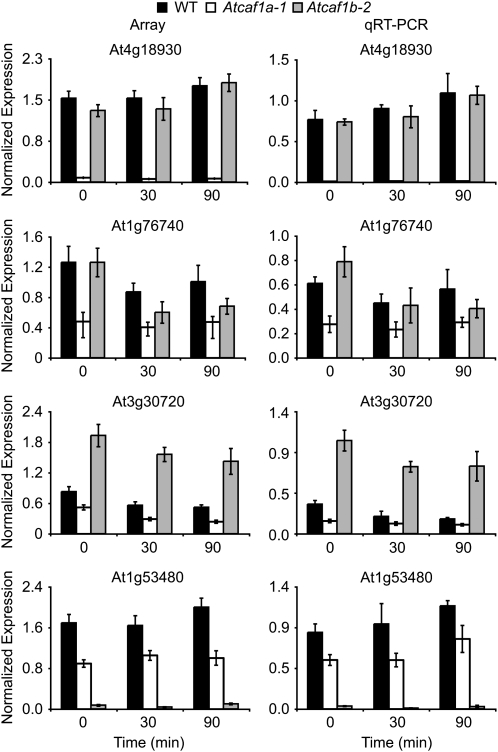
Figure 5.
Validation of Atcaf1a and Atcaf1b misexpressed genes. Normalized expression values from microarray (left) and qRT-PCR (right) for selected genes. Data are means of three independent biological replicates ±sem. For qRT-PCR, transcript levels were normalized to internal control genes (At4g34270 and At4g26410) measured in the same samples. WT, Wild type.

