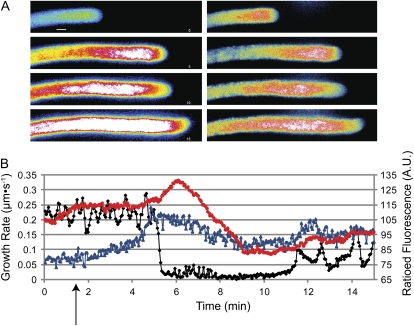
Figure 4.
JC-1 and NAD(P)H both react to oligomycin. A, The left-hand column presents pseudocolored NAD(P)H fluorescence images taken at 5-min intervals during inhibition with 10 μm oligomycin. The right-hand column shows JC-1 images from the same tube collected simultaneously. The JC-1 is less dramatic but reports the same change as the NAD(P)H signal. B, Traces of tip growth (black), JC-1 ratioed fluorescence (red), and NAD(P)H fluorescence (blue) of the same pollen tube shown in A. Oligomycin was added as shown by the black arrow. A.U., Arbitrary units.

