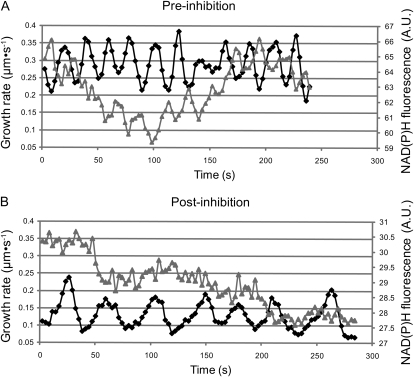
Figure 5.
Oscillatory growth before and after treatment with oligomycin. A, A control pollen tube grown in LPGM. Black trace represents growth of the tip, and gray represents the NAD(P)H fluorescence in a 10-μm box immediately behind the tip. Left y axis shows growth rate, whereas the right y axis shows average NAD(P)H fluorescence. Note that cross-correlation analysis reveals that the troughs of fluorescence precede the peaks in rate. B, A pollen tube after treatment with 40 μm oligomycin for approximately 10 min. The growth rate still oscillates though the period has changed (black trace). The fluorescence trace has lost coherence and no longer appears to oscillate (gray trace). A.U., Arbitrary units.

