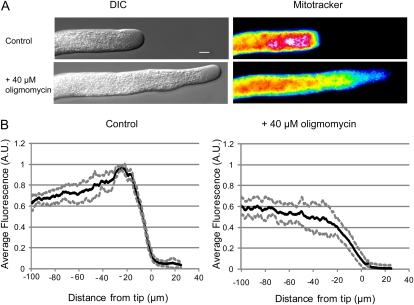
Figure 7.
Mitochondria redistribute in response to oligomycin. A, A DIC (left column) and pseudocolored epifluorescence (right column) image of a pollen tube treated with mitotracker Green-FM before (top two panels) and after (bottom two panels) treatment with 40 μm oligomycin. The intense peak directly behind the cell apex has dispersed, and the mitochondria are now evenly distributed. B, The average intensity along a line scan down the center of five pollen tubes was averaged and normalized. The black line represents the average value, and the gray lines represent the sd. The left-hand side shows the average prior to inhibition, and the right-hand side shows the average of the pollen tubes after inhibition. Note that though the average fluorescence is similar, there is now no apparent subapical peak and the values are more variable. A.U., Arbitrary units.

