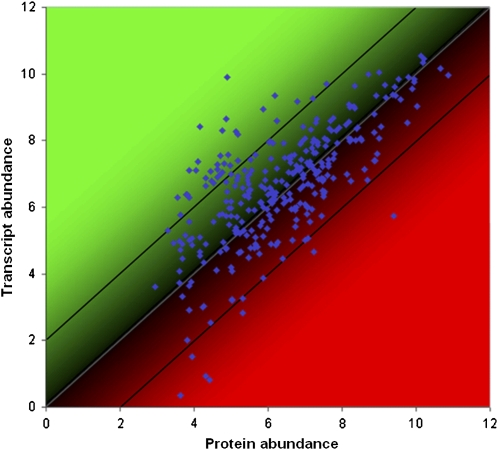
Figure 2.
Correlation analysis of transcript and protein abundance in Arabidopsis leaves based on 345 genes from various primary and secondary metabolism pathways. Transcript abundance was calculated as a representative expression vector derived from multiple Affymetrix ATH1 array measurements from leaf samples (data from Genevestigator, Hruz et al., 2008). The proteome data was obtained from distinct leaf samples. Approximately 20% of these genes/proteins had ratios of protein to transcript abundance deviating strongly from 1.

