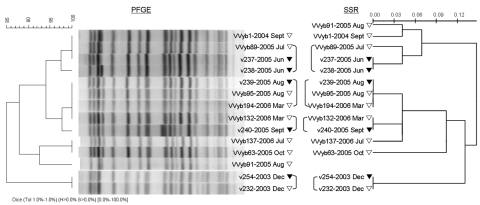
Figure 2.
Genetic relationships showing the epidemiologic connection among 12 clinical and environmental Vibrio vulnificus biotype 3 isolates based on pulsed-field gel electrophoresis (PFGE) analysis compared to analysis at 12 single-sequence repeat (SSR) loci. PFGE profiles were compared by using the Dice coefficient followed by unweighted pair group method with arithmetic mean clustering (tolerance, 1.0%). Scale bars represent pattern similarity (% for PFGE and genetic distance for SSR).

