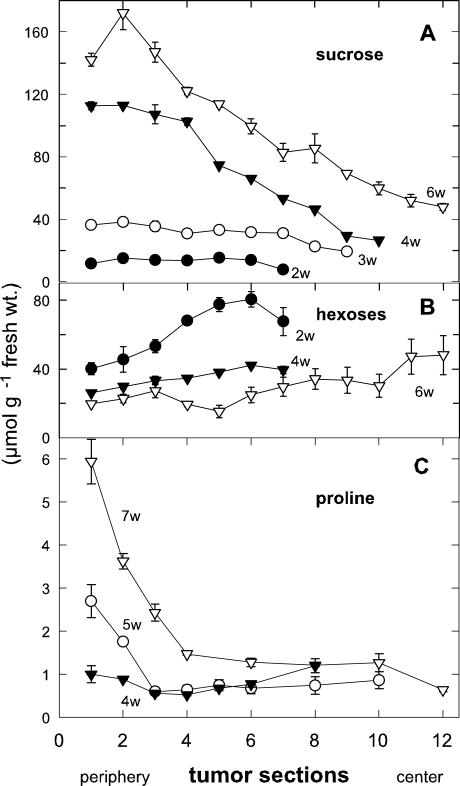
Figure 4.
Concentration gradients of Suc, hexoses, and Pro from the periphery to the center in castor bean tumors. A, Decreasing Suc concentration gradient and increase in Suc concentration with tumor age (w, weeks p.i.). B, Increasing hexose concentration gradient and decrease of hexose concentration with tumor age. C, Rapidly decreasing Pro concentration gradient and increase of Pro concentration with tumor age; mean values ± se (n = 3–6).

