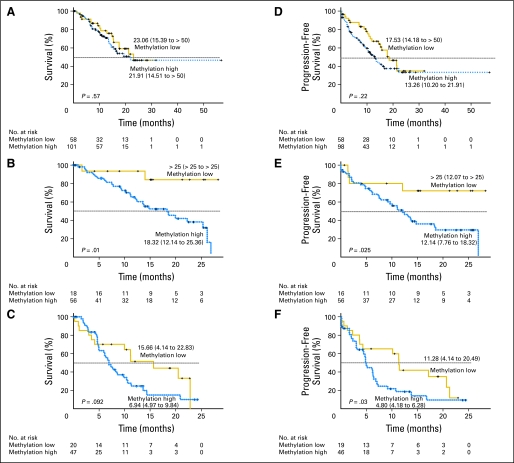
Fig 2.
The DNA methylation prognostic model and cytogenetic risk groups. The Kaplan-Meier estimates show survivals for groups of patients with cytogenetic good risk (A: overall survival; D: progression-free survivals), intermediate risk (B: overall survival; E: progression-free survival), and high risk (C: overall survival; F: progression-free survival).

