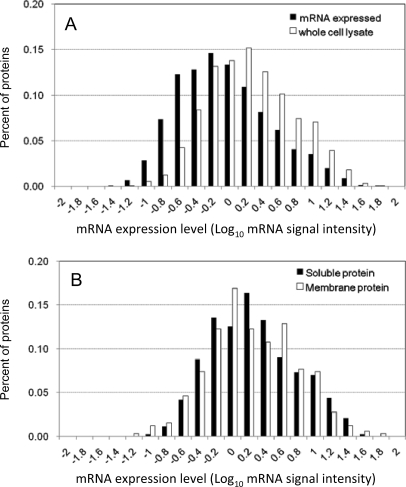
Fig. 1.
Comparison of E. coli mRNA expression profile with profile of the corresponding proteins identified by rapid PTS protocol from E. coli whole cell lysate. E. coli whole cell lysate (22.5 μg) was digested, and the resultant peptides were fractionated using SCX-StageTips (five fractions). These five samples were analyzed in triplicate by nano-LC-MS/MS using the LTQ-Orbitrap. A, the contents of proteins identified by the rapid PTS protocol (white bars) and mRNAs detected by DNA microarray (black bars) were plotted as a function of mRNA signal intensity. B, the protein abundance distribution for membrane proteins was compared with that for soluble proteins identified from the whole cell lysate.

