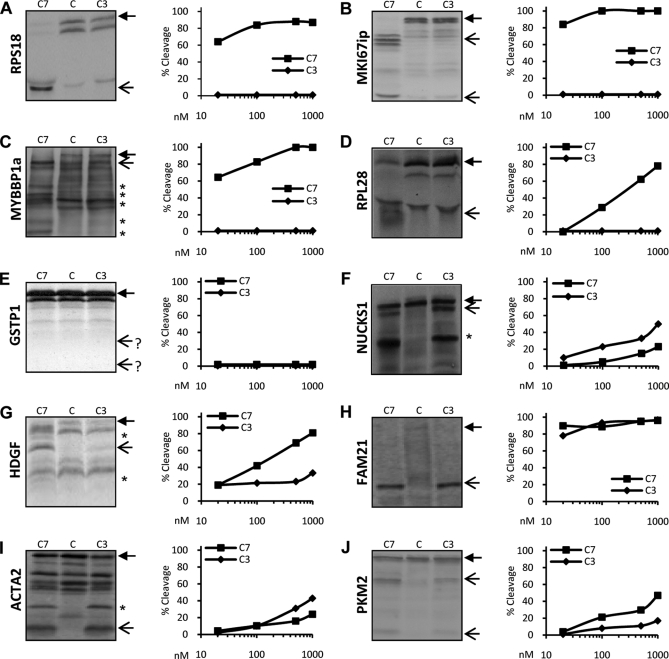
Fig. 2.
Caspase-7 and -3 cleavage efficiency of COFRADIC-identified substrates. RPS18 (A), MKI67ip (B), MYBBP1a (C), RPL28 (D), GSTP1 (E), NUCKS1 (F), HDGF (G), FAM21 (H), ACTA2 (I), and PKM2 (J) were transcribed-translated in vitro and labeled with [35S]methionine. Translated proteins were left untreated (C) or were treated with 10, 100, or 1000 nm recombinant C7 or C3 for 1.5 h at 37 °C and separated using SDS-PAGE, and the dried gels were exposed to autoradiograms (left panels; only samples treated with 1000 nm are shown). Densitometric analysis of the autoradiogram of each protein substrate was performed to determine the percent cleavage efficiency. For each caspase concentration, the percent of cleavage was calculated as the sum of the densities of the expected cleavage fragments divided by the sum of the densities of these fragments and the full-length protein. A closed arrow denotes the full-length protein. Open arrows indicate the expected caspase-mediated cleavage fragments. A star on the autoradiogram indicates cleavage fragments generated from cleavage sites not identified in the COFRADIC analysis.

