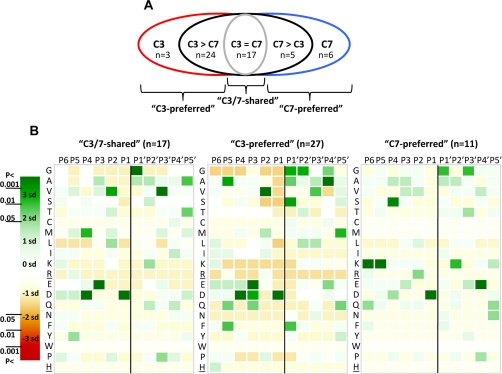
Fig. 3.
P6–P5′ cleavage site specificities of caspase-7 and -3. A, a diagram representing the five different groups of COFRADIC-identified caspase-3 and -7 cleavage events. “C3” and “C7” group the unique caspase-3 and -7 cleavage sites, respectively. “C3 > C7” contains the targets cleaved at least 2 times more efficiently by caspase-3, and “C7 > C3” contains the sites cleaved more than 2 times more efficiently by caspase-7. “C3 = C7” shows the sites cleaved equally by caspase-7 and -3 (C3/7-shared). The C3-preferred cleavage sites combine the C3 and C3 > C7 groups, and the C7-preferred cleavage sites combine the C7 and C7 > C3 cleavage sites. B, heat maps plotting the number of standard deviations (sd) that the frequency of an amino acid at each position in the C3/7-shared (n = 17) (left), C3-preferred (n = 27) (middle), or C7-preferred (n = 11) (right) cleavage sites differs from the frequency of randomly taken amino acids at a particular position (detailed under “Experimental Procedures”). The 95% (p < 0.05 = <1.96 × SD), 99% (p < 0.01 = <2.58 × SD), and 99.9% (p < 0.001 = <3.39 × SD) confidence thresholds are color-coded. Green indicates overrepresentation and red indicates underrepresentation of a particular amino acid at a certain position (P6–P5′ positions were analyzed). Arg and His residues (underlined) are not found at P′ positions as an artifact of the technique used. The scissile bond between P1 and P1′ is indicated by a vertical black line.

