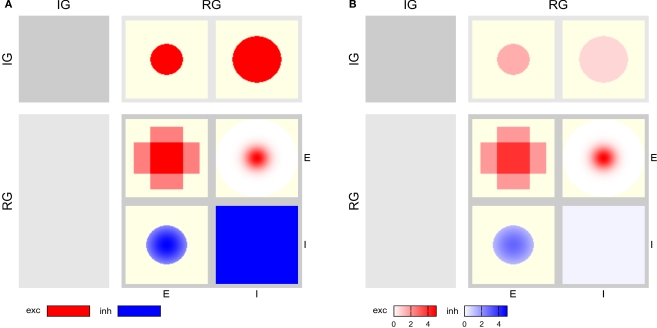
Figure 3.
CPTs for the Simple network connectivity defined in Table 1. Rows represent sources, columns targets. Excitatory connections are shown in red, inhibitory ones in blue. Saturation reflects the connection intensity defined as product of connection probability and synapse weight in arbitrary units. (A) Local color scale for each patch; patches with only a single value show fully saturated color. (B) Global color scale; only the maximum of the Gaussian RG/E→RG/I connection reaches full saturation. This CPT is discussed in detail in the section “Simple network CPT”.

