Figure 2.
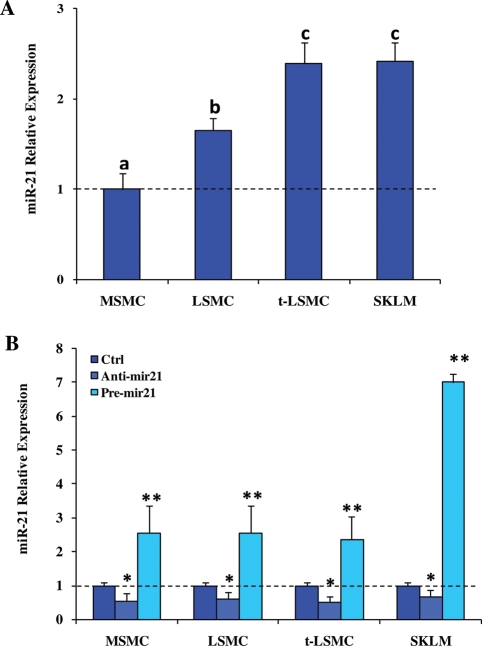
Relative level of miR-21 endogenous expression in MSMC, LSMC, t-LSMC and SKLM-S1 (A) and following gain- and loss- of function of miR-21 (B).
Cells were cultured and at 70% confluence, were transfected with 2′-O-MOE miR-21 inhibitor (anti-miR-21), pre-miR-21 or their respective scrambled control (Ctrl) oligonucleotides (50 nM) for 48 h. Total RNA was isolated from these cells and the level of miR-21 expression was determined using real-time PCR. The expression value in MSMC (A) and controls for each cohort independently (B) was set at 1. Different letters or number of asterisks indicate a significant difference among cell types and treatments, respectively, when compared with their respective controls (Ctrl) with P < 0.05 considered significant.

