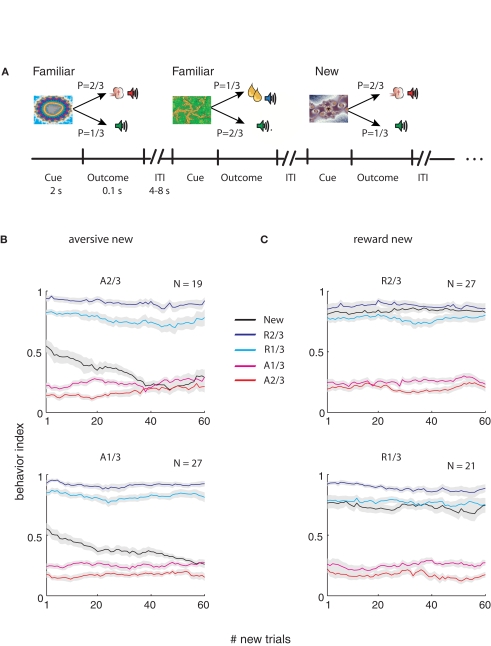
Figure 1.
Task and monkey behavior. (A) A schematic example of the flow of the behavioral task. Cues were followed by an outcome in a probabilistic manner. In each recording session a new cue was randomly interleaved between familiar cues. In this example the right fractal image is a new cue that follows familiar cues (the two left cues). (B) Behavior index (average ± SEM, across behavioral sessions) as a function of the number of new aversive trials. In each session the behavioral response (Lick – Blink) was calculated in a moving average of 20 new trials (and corresponding familiar events). Bin 1 is therefore the average of the first 20 trials, and so on. The responses were normalized between 0 and 1 for each session and then averaged across sessions. Top – new cue is p = 2/3 aversive cue. Bottom- new cue is the p = 1/3 aversive cue, The N in the top-right corner of each plot is the number of recording sessions. (C) Same as (B) for the sessions with new reward cues (Top, p = 2/3; bottom, p = 1/3 new reward cues).

