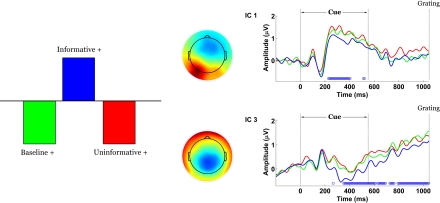
Figure 6.
Spatiotemporal patterns of scalp activity that differentiate Informative and Uninformative/Baseline conditions. Left: schematic indicates how the statistical contrast was coded. Middle: colour-coded topomaps indicate the weights in the ICA mixing matrix. Warmer colours represent positive weights. Right: condition-specific ERPs time-locked to cue onset and averaged across “+” cue trials, shown separately for each component. Blue dots above the abscissa indicate time points at which the statistical contrast is reliable by bootstrap test.

