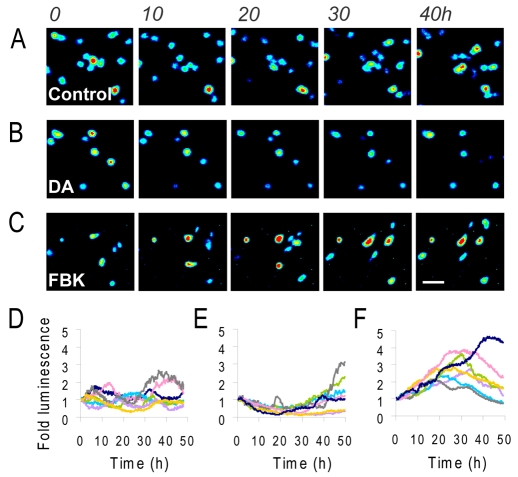
Fig. 3.
Real-time luminescence imaging of PRL transcription in living luminescent transgenic pituitary cells. (A-C) Representative luminescence images of individual cells dispersed from whole pituitary glands taken from luminescent transgenic rats with no treatment (control; A), 1 μM dopamine (B) or 5 μM forskolin and 0.5 μM BayK8644 (C). (D-F) Graphs of luminescent photon flux from individual cells with no treatment (control; D), 1 μM dopamine (E) or 5 μM forskolin and 0.5 μM BayK8644 (F). Each graph shows seven representative cell traces where luminescence signal per cell is normalised to the initial value per cell. Numbers above A show time in hours. Scale bar: 50 μm.

