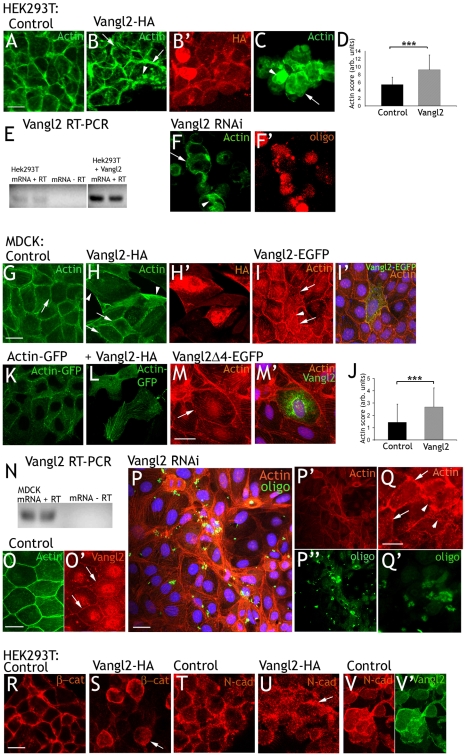
Fig. 1.
Vangl2 affects cell shape and actin distribution. (A) Control transfected HEK293T. Circumferential actin is continuous. (B,C) Cells overexpressing Vangl2-HA grow in sheets (B) with an irregular buildup, or in unstructured clusters (C). Circumferential actin is unevenly distributed (arrows), and intracellular actin deposits are observed (arrowheads). (B′) Vangl2-HA is located to the cell cortex and the cell cytoplasm. (D) On average, control cells received an acting rating of 3.4, Vangl2-expressing cells 7.2 Error bars represent s.d. ***P=8.78×10⁻⁹. (E) Reverse transcriptase (RT) PCR shows that untransfected HEK293T cell express Vangl2. Vangl2-overexpressing cells yield bands of the same size (dividing lanes have been omitted). (F) Vangl2 RNAi knockdown. Cortical actin is diffuse (arrow) and intracellular actin deposits (arrowhead) are abundant. (F′) Transfected cells are identified by a fluorescent oligo. (G) Control transfected MDCK cells grow in a regular pattern. (H) MDCK cells transfected with Vangl2-HA are irregular in shape and often larger than the surrounding untransfected cells. Actin is irregularly distributed in the cellular cortex and the cytoplasm (arrowheads). Note the difference in appearance to the two untransfected cells (arrows). Vangl2-HA distribution is shown in H′. (I) Vangl2-EGFP affects cells similarly as Vangl2-HA. Transfected cells are indicated by arrows. Arrowhead points at actin deposits in the cytoplasm. (I′) Merged panel shows actin in red, Vangl2-EGFP in green and DAPI in blue. (J) Blind rating of the actin distribution in control (score 1.4) and Vangl2-HA transfected cells (score 2.7). Error bars represent s.d. ***P=2.4×10⁻⁵. (K) MDCK cells transfected with actin-GFP. Note that all labeled cells are transfected. (L) Vangl2-HA affects cell shape and actin distribution. (M) Vangl2Δ4-EGFP has no apparent effect on MDCK cells. Arrow points at cortical actin in a transfected cell. (M′) Merged panel show Vangl2-Δ4-EGFP distribution. (N) RT PCR indicates the presence of endogenous Vangl2 in MDCK cells. (O,O′) Overlap between endogenous Vangl2 (arrows in O′) and circumferential actin. (P) Vangl2 RNAi knockdown affects cell size and actin distribution (only actin in P′, transfection indicated by oligo in P″). (Q,Q′) Vangl2 RNAi knockdown cells (arrowheads) stands out from adjacent untransfected cells (arrows). (R,T) β-catenin and N-cadherin display a similar distribution as actin in the cell cortex of control HEK293T cells. (S,U) Vangl2-HA expressing cells display a more diffuse, cytoplasmic distribution. (V,V′) N-cadherin (V) and endogenous Vangl2 (V′) overlap in the cell cortex of untreated HEK293T cells. Scale bars: 10 μm. Actin, FITC-phalloidin- or TRITC-phalloidin-labeled actin; HA, HA-tag; GFP, GFP fluorescence.

