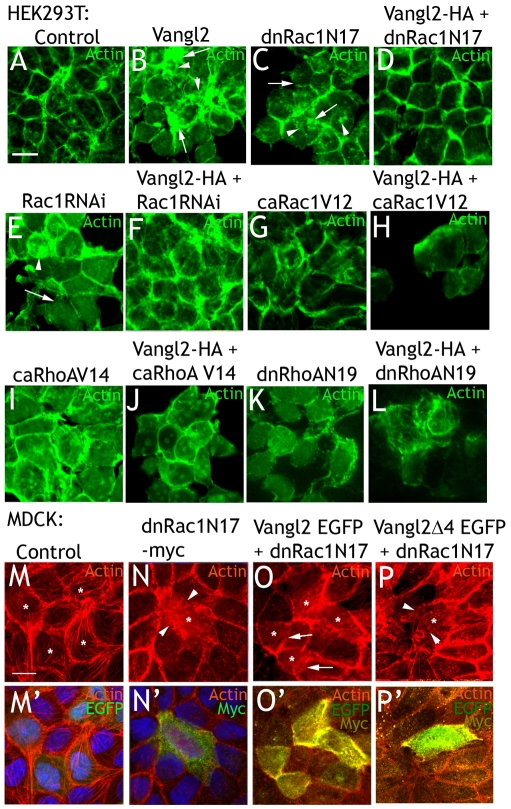
Fig. 3.
Rac1 mediates the effects of Vangl2 on the actin cytoskeleton. (A) Control transfected HEK293T cells. (B) Vangl2 transfection results in uneven cortical actin (arrows), and cytoplasmic actin deposits (arrowheads). (C) dnRac1N17 impairs cortical actin (arrows) and increases intracellular actin deposits (arrowheads). (D) Co-expression of Vangl2 and dnRac1N17rescues the cytoskeleton from the effects of either agent alone. (E) RNAi knockdown of Rac1 affects the actin cytoskeleton similarly to dnRac1N17. (F) Coexpression of Vangl2 and Rac1 RNAi results in close-to-normal cells. (G) caRac1V12 affects cell shape and actin distribution. (H) Vangl2 enhances the effects of caRac1V12. (I-L) caRhoAV14 (I) and dnRhoAN19 (K) affect cell shape and the cytoskeleton, but no combinatorial effect with Vangl2 is observed (J,L). (M,M′) MDCK cells transfected with EGFP control plasmid (indicated by *) display a similar actin distribution as surrounding, untransfected cells. (N,N′) A cell transfected with dnRAC1N17 (*) display aberrant shape and actin distribution (arrowheads). (O,O′) Cells co-transfected with dnRAC1N17 and Vangl2-EGFP (highly transfected cells indicated by *) are similar in shape and actin distribution as control transfected (M) and surrounding cells. This is particularly obvious in the transfected cells in the lower left (O, indicated by arrows). (P,P′) By contrast, Vangl2Δ4-EGFP is not able to negate the effects of dnRac1N17 in a highly transfected cell (*). Note the extreme paucity of cortical actin (arrowheads in P). (M-P) TRITC-phalloidin panels. (M′-P′) TRITC-phalloidin panels (M-P) merged with EGFP and Myc or DAPI channels. Scale bars: 10 μm.

