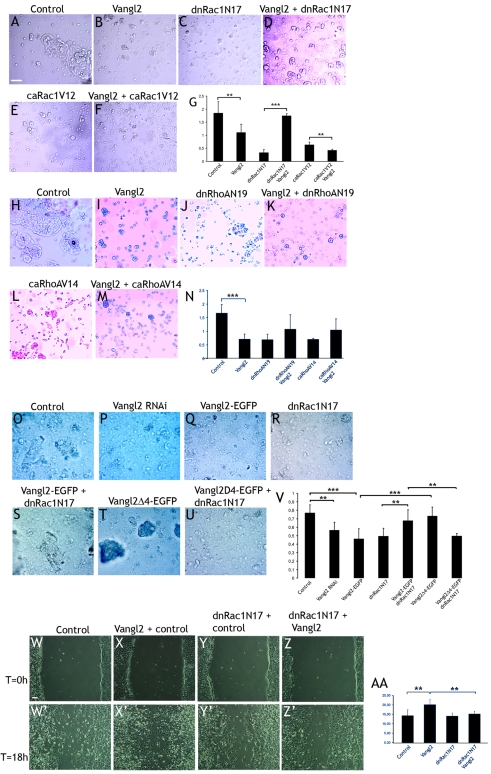
Fig. 4.
Vangl2 affects cell adhesion and migration in interaction with Rac1: aggregation assays with MDCK cells. (A-D) Control cultures display a high proportion of aggregated cells (A), whereas Vangl2 (B) or dnRac1N17 (C) significantly reduced cell aggregation. (D) Vangl2 combined with dnRac1N17 resulted in a close-to-normal level of cell aggregation. (E,F) caRac1V12 reduced cell aggregation (E), which was further enhanced by Vangl2 (F). (G) Graph with the respective aggregation indexes. (H-M) Vangl2 (I), dnRhoAN19 (J) or caRhoAV14 (L) reduces cell aggregation compared to control transfected cells (H). Addition of Vangl2 does not modify the effects of dnRhoAN19 (K) or caRhoAV14 (M). (N) Quantification of the results. (O,P) Vangl2 RNAi reduces cell aggregation compared to control transfected cells. (Q-S) Vangl2-EGFP (Q) and dnRac1N17 (R) alone reduces aggregation, whereas the combination of Vangl2-EGFP and dnRac1N17 results in close to normal aggregation levels (S). (T) Vangl2Δ4-EGFP results in normal aggregation (95% of control). (U) However, Vangl2Δ4-EGFP is not able to counter the effects of dnRac1N17. (V) Quantification of the results. (W-Z′) Vangl2 increases cell migration in a wound assay. Pictures of the same area were taken at the start of the experiment (T=0, W-Z), and after 18 hours (T=18 hours, W′-Z′). Vangl2-transfected cells (X′) colonize the inflicted wound to a higher extent than the control transfected cells (W′). Dominant-negative Rac1 blocked the effects of Vangl2 in cell migration (Z′), but did not by itself affect cell migration (Y′). (AA) Quantification of the results. Scale bars: 100 μm. Error bars in G, N, V and AA represent s.d. **P=0.03-0.05, ***P<0.01.

