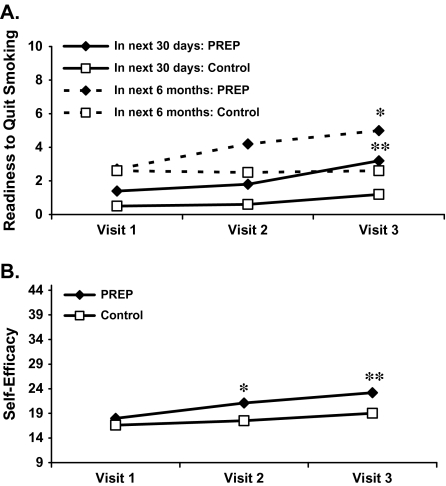
Figure 2.
(A) Changes in readiness to quit (0–10 scale). Significant Group × Time interaction for readiness to quit both in the next month (p < .001) and within the next 6 months (p = .04) (*significantly different from Visit 1, p < .01; **significantly different from Visit 1, p = .03). (B) Changes in self-efficacy to quit (9–45). Significant Group × Time interaction (p < .001) (*significantly different from Visit 1, p < .05; **significantly different from Visit 1, p < .001).

