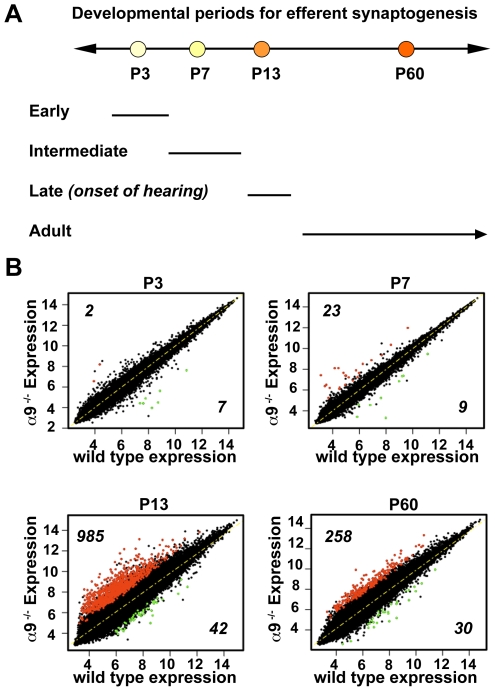
Figure 1. Overview of differentially expressed genes in the α9−/− compared to wild type.
(A) The ages indicate the postnatal (P) days at which cochlear RNA samples were prepared. Efferent innervation in the cochlea peaks around P7 when most of the efferent axons are contacting inner hair cells. Between P7 and P13, the axons are pruned and retargeted to outer hair cells. P13 also marks the initial phase of auditory function stabilization in rodents. Microarray analyses were based on comparative analyses of α9−/− and wild type at P3, P7, P13 and P60. (B) Comparison of expression levels of all probes between α9−/− samples and wild type controls at each age. Normalized gene expression data are plotted on a logarithmic scale (log2), and genes changing in the α9−/− by at least 1.5 fold and differentially expressed using the limma package in R (FDR q-value <5%) are highlighted for each age. Red dots correspond to significant up-regulation and green to significant down-regulation in the knockout animals compared to wild type controls. Numbers of up- and down-regulated genes are also noted in the plots.

