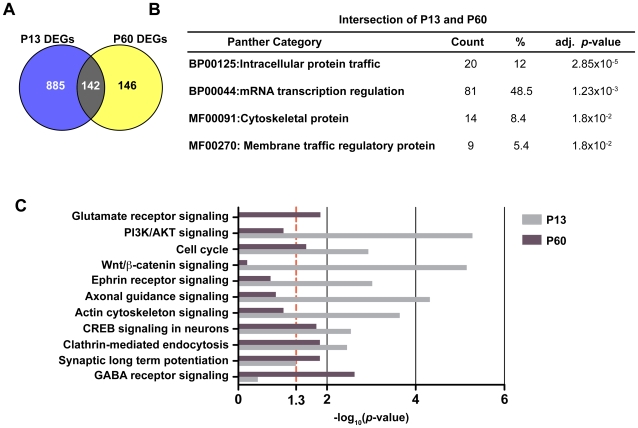
Figure 2. Functional categories of genes significantly over-represented in α9−/−.
(A) Venn diagram depicting the overlap among differentially expressed genes (DEGs) between P13 and P60. The intersection of differentially expressed genes between wild type and α9−/− consists of 142 genes. (B) Over-represented classes among these 142 genes are shown (DAVID, BH-adjusted p-value <0.05). (C) Comparative enrichment of functional categories (Ingenuity database; −log10 (enrichment p-value)) between P13 and P60 are indicated; larger values indicate higher significance. The dotted line at 1.3 corresponds to p-values of 0.05 on this scale.

