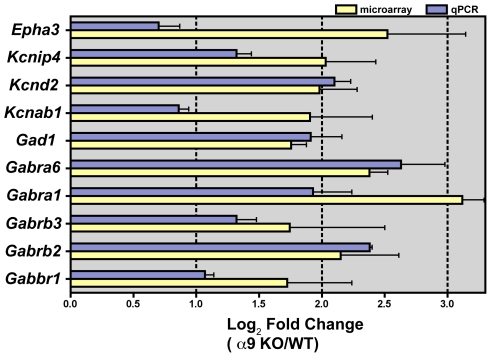
Figure 3. Confirmation of selected genes at the transcript level.
(A) Log2 fold changes in expression levels of selected transcripts measured by qPCR are plotted alongside their fold changes obtained by microarray analysis. For the ten selected genes, expression values from microarray and qPCR showed similar relative changes (p<0.05, two-tailed t-test). Error bars indicate SEM.

