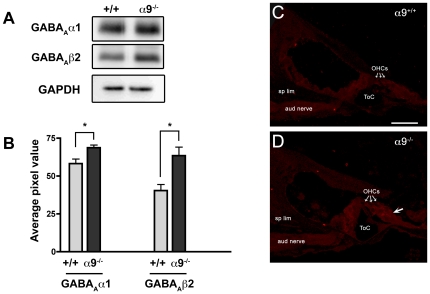
Figure 4. Quantitative protein expression analysis of select GABA receptor subunits and cellular localization of changes to GABAAβ2 expression.
(A) Protein expression of GABAA subunits was assessed by immunoprecipitation (IP) to confirm changes observed at a transcriptional level. 200 µg cochlear lysates from wild type and α9−/− were subjected to IP with antibodies against GABAAα1 and GABAAβ2 subunits. The immunoprecipitates were analysed by western blotting with anti-GABAAα1 or anti- GABAAβ2. A separate western blot was run in parallel using the same lysates used for IP experiments for wild type and α9−/− samples. A representative western blot including GAPDH loading control is shown. (B) Quantitative western blot analyses for GABAAα1 and GABAAβ2 are shown. Average pixel values averaged over biological triplicates from IP experiments are indicated for wild type and α9−/−. GABAAα1 protein expression increased by 18% in α9−/− (p = 0.041) and GABAAβ2 expression increased by 58% in α9−/− (p = 0.029) when compared to wild type. Error bars indicate SEM, and a significant change is denoted with an asterisk (two-tailed t-test). (C) In adult wild type ears, GABAAβ2 immunostaining is observed in the inner and outer hair cells. (D) In α9−/− OHCs, GABAAβ2 immunolabeling is particularly dense in the apical regions, as well as at the synaptic pole. The small arrows indicate outer hair cells and the larger arrow in (D) indicates the border between outer hair cells and Deiters' cells. Sp lim, spiral limbus; ToC, tunnel of Corti; OHC, outer hair cell. Scale bar, 25 µm.

