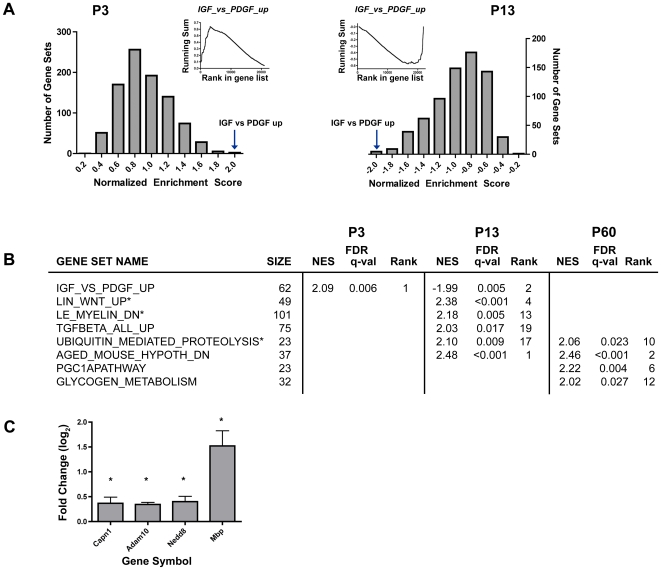
Figure 5. Gene set enrichment analysis of α9−/− and wild type.
(A) GSEA analysis of IGF1_vs_PDGF gene set. The inset depicts the running sum for the IGF1_vs_PDGF gene set at each gene in the rank-ordered list comparing α9−/− and wild type at P60. The enrichment score is the maximum (up-regulated molecules) or minimum (down-regulated molecules) deviation from zero. The main plot shows the frequency distribution of normalized enrichment scores for all 1,390 gene sets. The arrow points to the bin that includes the IGF1_vs_PDGF gene set. (B) Several significantly differentially expressed gene sets with particular roles in synapse development or function are shown at P3, P13 and P60 (FDR q-value <0.05). Rank indicates the position of the gene set when compared to all others (a total of 1,390). (C) Log2 fold changes from qPCR validations are shown for four genes that were selected from three gene sets: Capn1 (LIN_WNT_UP), Adam10 and Mbp (LE_MYELIN_DN) and Nedd8 (UBIQUITIN_MEDIATED_PROTEOLYSIS). A significant change is denoted with an asterisk (p<0.05, two-tailed t-test).

