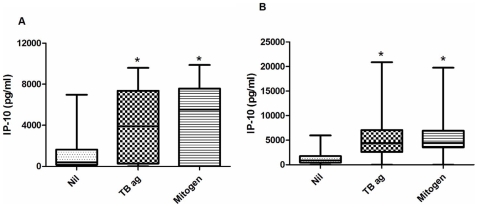
Figure 1. The levels of IP-10 in unstimulated, TB antigens stimulated and mitogen stimulated samples of healthy controls (a) and PTB patients (b).
The levels of IP-10 in TB antigen stimulated and mitogen stimulated samples were significantly higher than unstimulated samples. Box and Whisker plots show range, inter-quartile range and median. Nil – unstimulated; TB ag – TB antigens stimulated; mitogen- mitogen stimulated samples. *significant difference p<0.05 by Kruskal- Wallis test.

