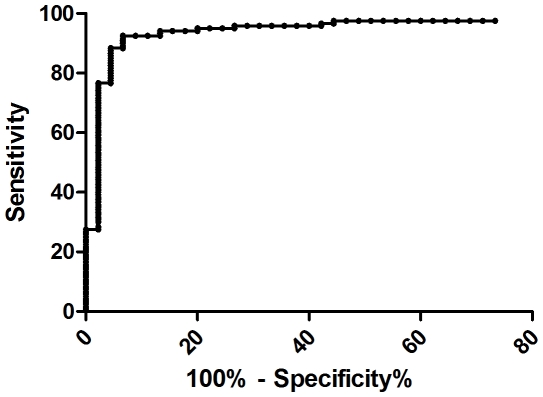
Figure 3. ROC curve analysis for TB antigens specific IP-10.
The cut-off value for TB antigens specific IP-10 levels was determined by using QFT-IT and TST negative healthy controls as uninfected and culture confirmed TB patients as diseases subjects. The area under curve was 0.946 (95% CI: 0.905–0.987). TB- tuberculosis; IP-10-Interferon gamma inducible protein-10; QFT-IT – QuantiFERON-TB Gold in-tube; TST – Tuberculin Skin test; CI-Confidence interval.

