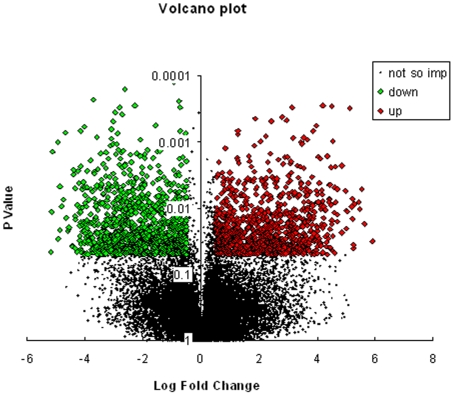
Figure 1. A volcano plot of genes altered by TNFα in HepG2 cells.
Log2 fold changes and their corresponding p-values of all genes in the microarray were taken for construction of the volcano plot. Genes up-regulated with more than 1.5 fold change with a p-value <0.05 are depicted in red boxes and those down regulated with identical fold change and p-value are in green boxes. All other genes in the array that were not found to be significantly altered are in black dots.

