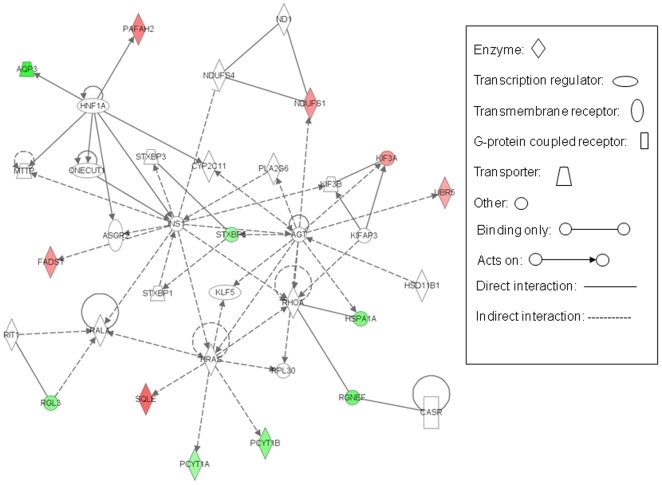
Figure 5. Interacting network among genes altered by TNFα in HepG2 cells.
Functional interacting network among genes altered with a log2 ratio of ±0.5 in HepG2 cells by TNFα. All such genes were uploaded in the Ingenuity Pathway Analysis tool and the network of “lipid metabolism, small molecule biochemistry, nervous system development and function” that was identified with a significant score is depicted. Genes from our dataset and falling in this network are shown in either red (up-regulated) or green (down regulated) with the intensity of the color being an indicator of the fold change.

