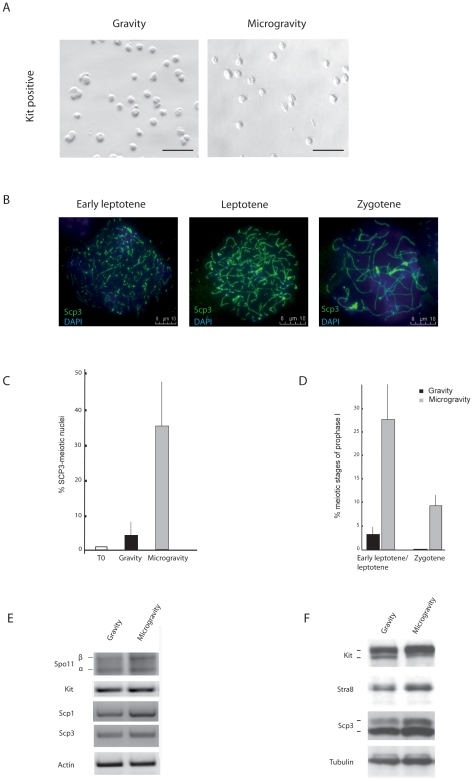
Figure 2. SM induces meiotic entry of Kit-positive spermatogonia.
A) Morphology of Kit-positive spermatogonia from testes of 7dpp mice after 2 days of culture under SM and unit gravity seen at light microscopy. Scale bar, 100 µm. B) Representative immunofluorescence images showing Scp3 organization on nuclear spreads at different stages of meiotic prophase I made on cultured spermatogonia. Scale bar, 10 µm. C, D) Histograms representing the percentage of nuclei with a typical meiotic Scp3 organization (C) and relative amount of early leptotene/leptotene and zygotene meiotic figures (D) after 48 h of cultures kept at unit gravity and in SM. The percentage of Scp3-positive cells present in freshly collected Kit-positive cells is shown as T0. The values were obtained by counting 400 nuclei in each sample. Data are means ± SD of at least four independent experiments. P≤0.005. E, F) Representative semiquantitative RT-PCR (E) and western blots (F) for pre-meiotic markers Kit and Stra8 and meiotic markers Spo11, Scp3, Scp1 in spermatogonia under SM versus gravity cultures. Similar results were obtained in three separate experiments. See Table 1 for quantitative data.

