Fig. 3.
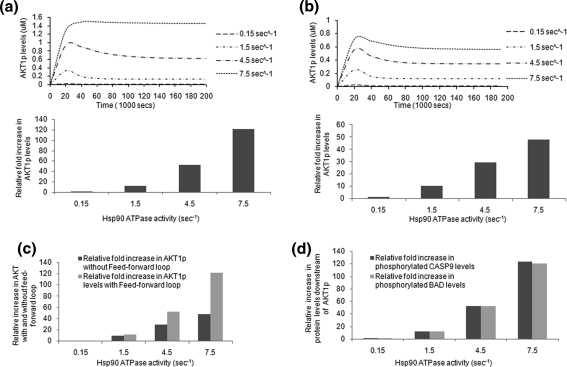
Effect of increasing Hsp90 ATPase activity on Akt-1 and its downstream targets. a Shows increase in active Akt-1 level with feed-forward loop. b Shows increase in active Akt-1 level without feed-forward loop. The upper panel in a and b show the graphic representation of simulation. Simulation program was run for 2 × 10⁵ s and the protein concentration was taken when it reaches saturation. c Comparison between relative change in Akt-1 level with and without feed-forward loop. d Activated levels of downstream targets of Akt-1 in the survival pathway also increases with increasing Hsp90 ATPase activity. The increase in CASP9p and BADp levels corroborates with that of Akt-1

