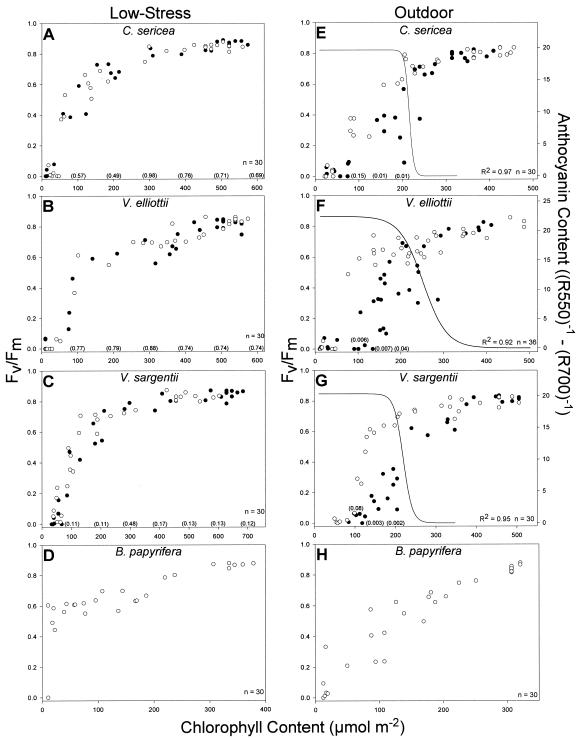
Figure 1.
Progression during senescence of the relationship between Fv/Fm and Chl content for mutant (•) and WT (○) plants of each anthocyanin-producing species and B. papyrifera for the low-stress (A–D) and outdoor (E–H) treatments. P values for differences in Fv/Fm between mutant and WT regressions are indicated parenthetically on the graphs at intervals of 100 μmol m–2 Chl content for the low-stress treatment and 50 μmol m–2 Chl content for non-senesced anthocyanic leaves for the outdoor treatment. The development of anthocyanins in senescing leaves of WT plants from the outdoor treatment is indicated on the graphs of the anthocyanin-producing species by a three-parameter sigmoid line: [y = a/1 + e ^ – (x – x0/b)], representing the leaf reflectance index (R550)–1 – (R700)–1 for each data point on the graphs.

