
Fig. 2.
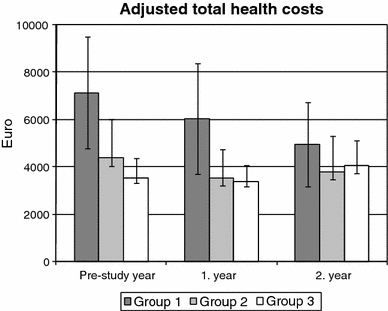
Adjusted total health costs per patient and year. Estimated marginal means and 95% confidence intervals (CI) after adjustment for socio-demographic characteristics, comorbidity and baseline health status (see text for details). Group 1: patients treated for depression; Group 2: patients treated for another disorder, with depressive symptoms; Group 3: patients treated for another disorder, without depressive symptoms