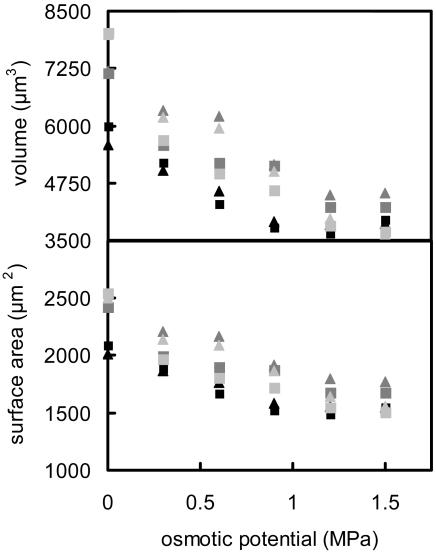
Figure 4.
Guard cell surface area and volume as affected by increasing the osmotic pressure of the external solution. Data are for six guard cells; each symbol represents a different cell. Approximately 10 min were allowed for equilibration after each change in the osmotic potential of the buffer solution.

