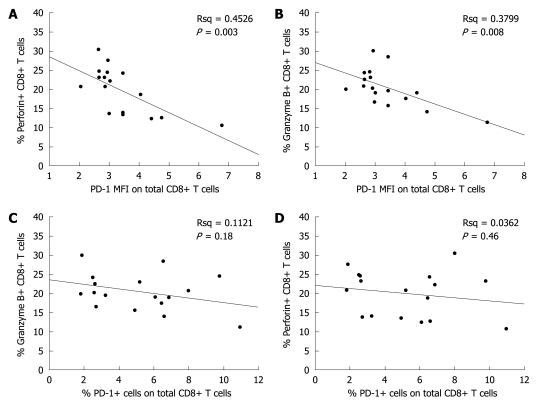
Figure 3.
Relation between PD-1 expression level in CD8+ T cells and CD8+ T-cell responses in the immune clearance stage of chronic HBV infection. A: Inverse relation between the percentage of perforin and PD-1 MFI in positive CD8+ T cells; B: Inverse relation between the percentage of granzyme B and PD-1 MFI in positive CD8+ T cells; C: No correlation between the percentages of granzyme B and PD-1 in positive CD8+ T cells; D: No significant correlation between the percentages of perforin and PD-1 in positive CD8+ T cells.

