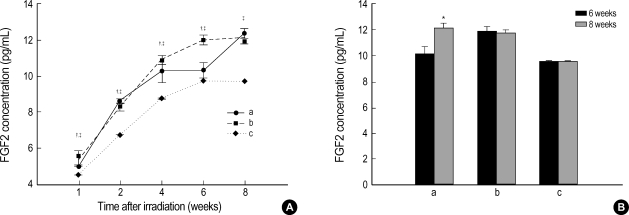
Fig. 4.
(A) Expression of FGF2 according to the time after irradiation. Whereas the level of expression of FGF2 was significantly higher at 2 and 8 weeks than in the right hemisphere (craniectomy site) of the sham operation group, the expression showed a significant decrease at 1, 4, and 6 weeks (unpaired t-test, p<0.05). As compared with the left hemisphere (non-craniectomy site) of the sham operation group, the concentration of FGF2 in the radiation group was significantly increased at 1, 2, 4, 6 and 8 weeks (p<0.05). (B) While the concentration of FGF2 at 8 weeks was lower than that at 6 weeks in the sham operation group, there was a significantly steep incline of expression in the radiation group between 6 and 8 weeks, similar to that in the VEGF study (unpaired t-test, p<0.05). a: right hemisphere (craniectomy site) in the radiation group; b: right hemisphere (craniectomy site) in the sham operation group; c: left hemisphere (non-craniectomy site) in the sham operation group.
*p<0.05 by unpaired t-test within the radiation group, †p<0.05 by unpaired t-test compared between radiation and sham operation groups, ‡p<0.05 by unpaired t-test compared between right hemisphere of the radiation group and left hemisphere of the sham operation group.

