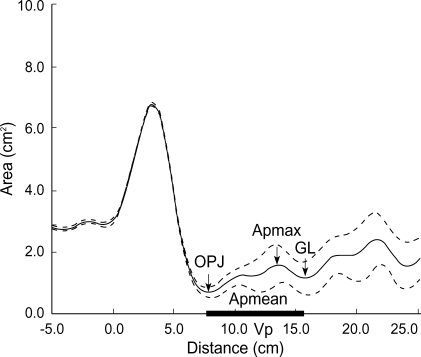
Fig. 1.
Representative output of the acoustic pharyngometry. There are 5 parameters on graph as shown in arrow and thick line. OPJ, oropharyngeal junction area; Apmax, maximum pharyngeal area; GL, glottic area; Apmean, mean pharyngeal area from OPJ to GL; Vp, pharyngeal volume as the integrated area under the curve between the OPJ and the GL. All the parameters were calculated by computer system.

