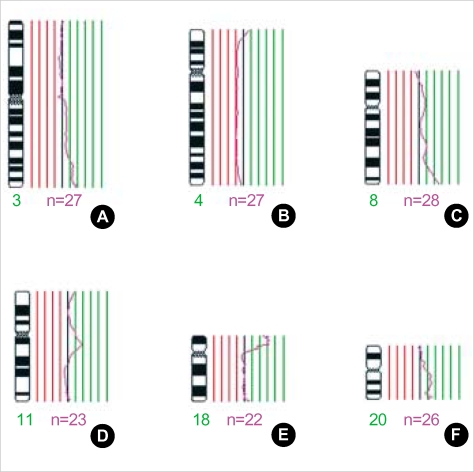
Fig. 2.
Examples of the CGH profiles of chromosomal aberrations in ICC. Red and green lines represent thresholds for chromosomal losses (0.75) and gains (1.25), respectively. (A) Gain of 3q26-qter was detected, (B) Deletion of 4p15-qter was observed, (C) Overrepresentation of 8q22-qter with high amplification of 8q24 was found, (D) Gain of 11p11-q13 was detected, (E) Gain of 18p was observed, (F) Gain of 20q was found. *n=number of chromosomes evaluated.

