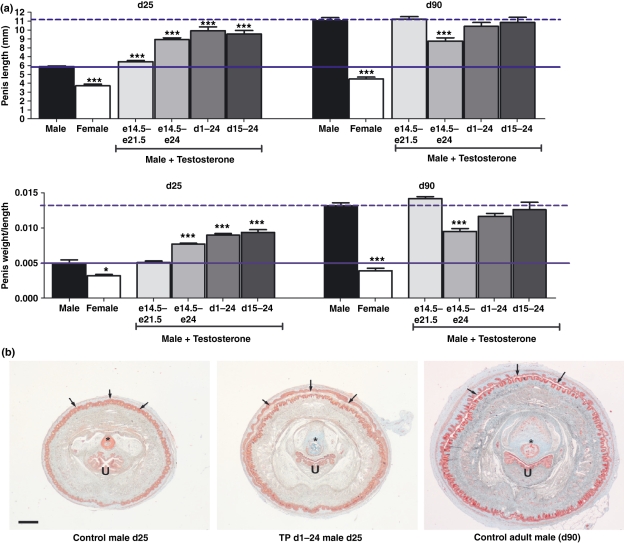
Figure 3.
(a) Penile length (top panels) and weight/length (lower panels) at mid-puberty (d25) or in adulthood (d90) in male rats exposed in utero (e14.5–e21.5) or postnatally from d1 to d24 or from d15 to d24, or a combination of prenatal and postnatal exposure (e14.5–d24), to testosterone propionate (TP). Data are shown for vehicle-treated males (controls) and females for comparison. Solid horizontal line shows the mean penile length for control males at d25 and the dashed horizontal line shows the mean for d90 male controls. *p< 0.05, **p< 0.01, ***p< 0.001, in comparison with the respective control group. Values are means ± SEM for the number of animals shown in Table 1. (b) Representative penile cross-sectional morphology in the control rats at d25 (left) and d90 (right) in comparison to a d25 rat treated postnatally from d1 to d24 with TP (middle). In the latter, note the increased penile diameter, preputial separation (small arrows) and ossification of the os penile bone (*blue-green staining) in comparison with the d25 control, and its advancement towards the adult phenotype. Sections were stained with Goldners as described elsewhere (Welsh et al., 2008). Scale bar shows 0.5 mm. U, urethra.

