Figure 8.
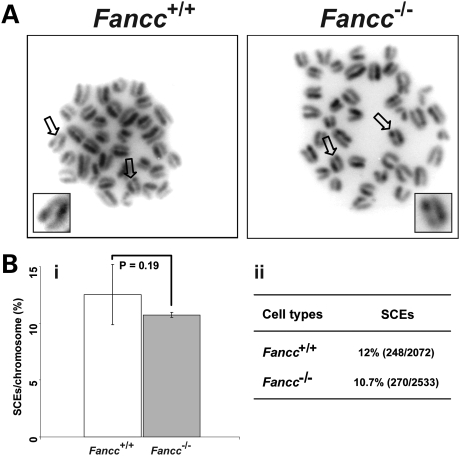
The frequencies of genome SCEs are comparable between HG5 Tert+/− Fancc+/+ and Tert+/− Fancc−/− mouse bone marrow cells. (A) Representative metaphase spreads of bone marrow cells with indicated genotypes, showing genome SCE events. (B) (i) The incidences of genome SCEs are comparable between Tert+/− Fancc+/+ and Tert+/− Fancc−/− bone marrow cells (n = 4). Arrows indicate genome SCE events. (ii) The frequencies are derived from the number of SCE events divided by total number of chromosomes (%).

