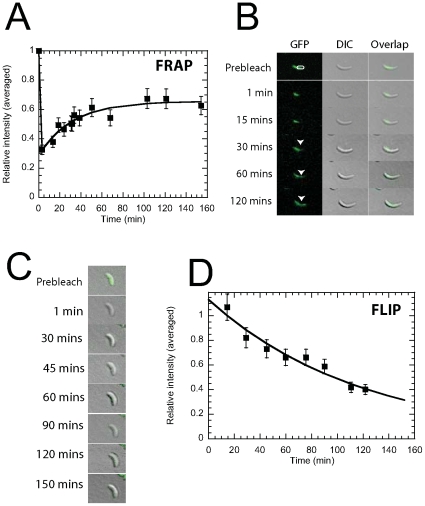
Figure 1. In vivo dynamics and FRAP/FLIP analysis of crescentin-GFP in C. crescentus.
A, crescentin-GFP FRAP kinetics. The half-life time for recovery is t1/2 = 26±1.9 min (n = 12). The curve is a fit based on a FRAP kinetics model. B, Time-lapsed fluorescence microscopy images of crescentin-GFP following photobleaching in the indicated region of the cell. Columns show selected images before and after photobleaching. Arrow heads show fluorescence recovery in bleached region (white circle) of cells. Columns correspond to DIC, GFP fluorescence and overlay, respectively. C, Overlaid DIC and crescentin-GFP fluorescence micrographs in a cell that has been completely photobleached. The cell does not recover its fluorescence. D , Crescentin-GFP FLIP kinetics. A region in the cell was repeatedly photobleached for 120 min and the loss in fluorescence in the rest of the cell was measured. The rate of FLIP is 0.50±0.18 h−1 (n = 12 cells) (mean ± standard error). The curve is a fit based on a FLIP kinetics model.

