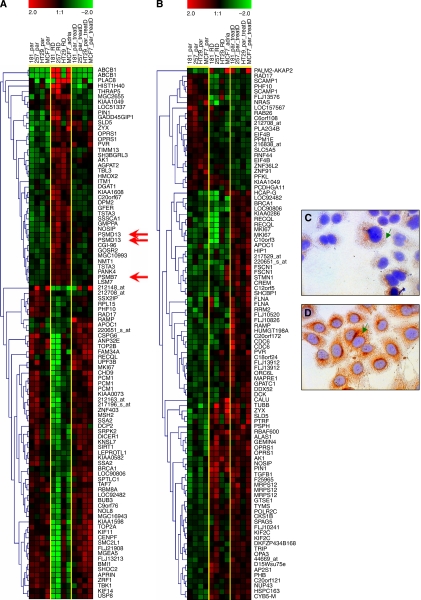
Figure 2.
Discriminating transcripts: (A) hierarchical clustering of all three groups (parental, treated parental, resistance cell line) against each other and (B) hierarchical clustering of parental vs treated parental cell lines. Red arrows show appearance of three probe sets measuring proteasome subunits on resistance-associated gene list. Immunohistochemical localization of PSMB7 expression in sensitive (C) and resistant cells (D). Reactions of cytoplasmic localization were obtained for PSMB7 (green arrows).

