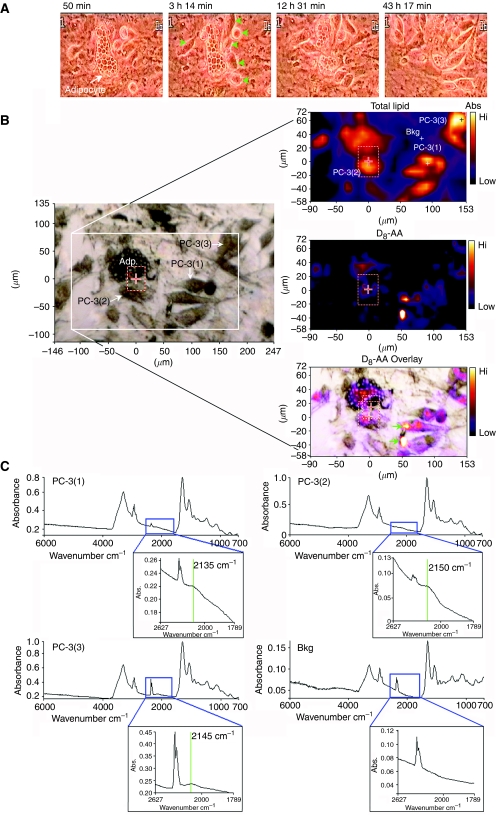
Figure 4.
PC-3 cells target and take-up arachidonic acid (AA) from AA-loaded human bone marrow adipocyte (BM-Ad). (A) Interaction of PC-3 cells co-cultured with AA-pulsed adipocytes from human BM mesenchymal cells followed by time-lapse video-microscopy. Adipocyte=white arrow, PC-3 cells=green arrows. (B) Photomicrographs showing separate phase contrast, total lipid and D8-AA Fourier Transform Infrared spectroscopy (FTIR) spectral image and a phase contrast D8-AA overlaid image of a PC-3 D8-AA loaded BM adipocyte (Adp) co-culture. (C) Fourier Transform Infrared Spectroscopy spectra of four regions defined in the phase contrast and total lipid spectra photomicrograph shown in B, with inset high-resolution spectra of the 1789–2627 cm−1 region corresponding to D8-AA. Bkg=background.

