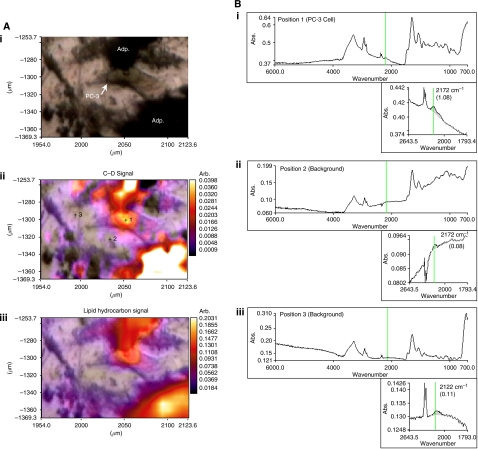
Figure 5.
Arachidonic acid (AA) localises around the nucleus following uptake by PC-3 cells. (Ai) Phase contrast image of a PC-3/bone marrow adipocyte (BM-Ad) co-culture showing a PC-3 cell flanked top and bottom by D8-AA loaded adipocytes; (Aii) Fourier Transform Infrared spectroscopy (FTIR)-spectral micrograph of the υ(C–D) signal overlaid on to the optical photomicrograph, with increasing signal absorbance depicted by a shift towards red/white colours; (Aiii) FTIR-spectral micrograph of the total lipid hydrocarbon signal overlaid onto the optical photomicrograph with increasing signal absorbance depicted by a shift towards red/white colours. (B) Fourier Transform Infrared spectroscopy-spectral signatures from i) PC-3 cell, (ii+iii) background as defined in Figure 6Ai and Aii. Fourier Transform Infrared spectroscopy Spectral profiles (inset) concentrate on the 1793.4–2643.5 cm−1 region encompassing the (C, D) spectral region (highlighted by the green vertical line).

