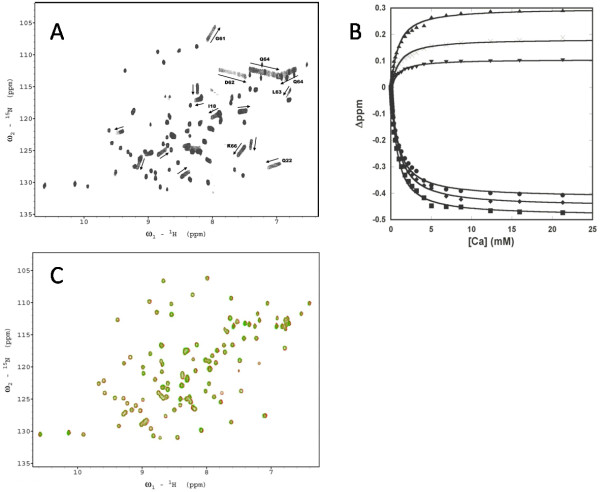
Figure 4.
Metal binding studied by 2D-NMR. (A) The 1H-15N HSQC spectra of EEDDQ at different Ca2+ concentrations. The Ca2+-induced chemical shift perturbations are indicated by the arrows. Several assigned resonances are labeled. (B) Determination of the Ca2+-binding affinity of EEDDQ by following the chemical shift perturbations as a function of Ca2+ concentration. D62 (solid circle); downfield resonance of Q64 sidechain amide (solid square); upfield resonance of Q64 sidechain amide (solid triangle); K66; ×, Q22 (inverted solid triangle). The solid lines are generated by assuming a 1:1 Ca2+ binding to EEDDQ. The results from different resonances are similar. (C) Overlay of the HSQC spectra of NENDN in the presence of 0.05 mM EGTA (red) or 13.1 mM Ca2+ (green).

