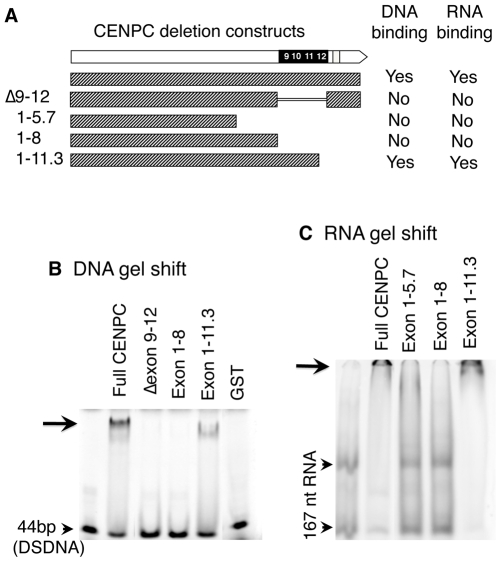
Figure 2. DNA and RNA binding localize to exon 9–12.
(A) Schematic representation of CENPC constructs used. (B) DNA binding. Radiolabeled 44 bp DSDNA was incubated with equal amounts of the different CENPC fragments. A shifted band (arrow) was seen for full CENPC and Exon 1–11.3, but not for Δ Exon 9–12, Exon 1–5.7 or Exon 1–8. As a negative control, GST (Glutathione S-transferase) was tested and no band shift was seen. (C) RNA binding. Radiolabeled 167 nt RNA was incubated with equal amounts of different CENPC fragments. Free RNA appears as two bands as expected for a long RNA with double stranded character (arrowheads). A shifted band, which is too large to enter the gel matrix (but visible, see arrow), was seen for full CENPC and Exon 1–11.3, but not for Exon 1–5.7 or Exon 1–8.

