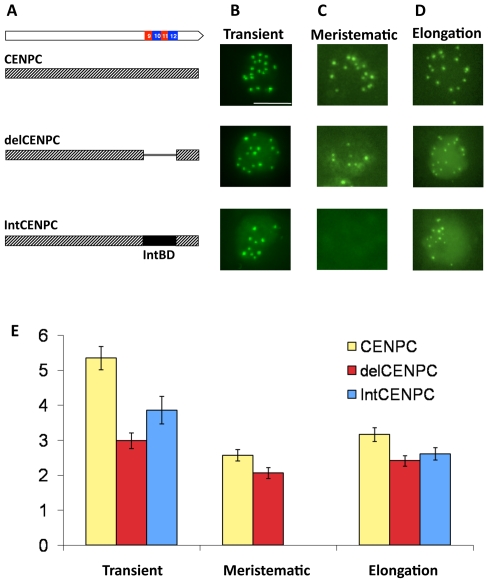
Figure 5. Removal or replacement of Exon 9–12 delocalizes CENPC in vivo.
(A) Schematic representation of the YFP–CENPC constructs used in maize transformation. (B) Transient expression of YFP–CENPC in cultured cells. The green YFP spots represent kinetochore localization, as determined from fixed cells (Figure 6). (C) Fluorescence in root tips of stably transformed plants. (D) Fluorescence in the elongation zone of stably transformed plants. Images are projections showing all YFP signal (green) from single nuclei. (E) Quantification of the data in (B–D). The Y axis represents the ratio of YFP signal in kinetochores to YFP signal in the nucleoplasm. There are significant differences between full CENPC and delCENPC and IntCENPC in all three types of tissue (P<0.05, bars show SEM).

