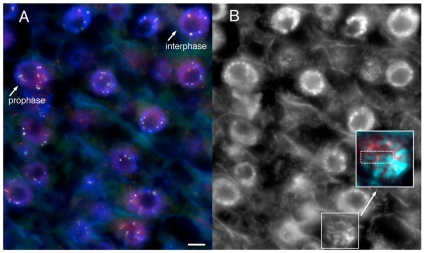
Figure 6. YFP–CENPC localizes to kinetochores.
(A) A cryostat section from a root tip, showing cells in various stages of the cell cycle. YFP–CENPC is labeled by anti–YFP antisera (red), while YFP itself is shown in green. The red and green signals overlay to produce a yellow color. DNA (DAPI) is shown in blue. Cells in interphase and prophase are noted and differentiated by chromatin staining. Kinetochores on prophase chromosomes are noted with arrows to show the paired spots on replicated chromatids. (B) A black and white version of the DNA stain in (A). An early prophase cell is enlarged in the panel to highlight a single chromosome, with anti–YFP staining (red) lying in the primary constriction. Each kinetochore is noted with an arrow. Bar = 5 µm.

